
The View/Edit/Compile/Run environment enables students to edit, compile, and run C, Java, and Korn shell programs via a web interface to a Unix server. It provides separate home directories for each course enabled on the system. Each user course directory contains subdirectories for ten projects, a1, ..., a10, and each project contains four C (or C++), Java, dash, octave, and Python files, as well as editable Makefile, text, C/C++ headers, and flex/bison scan.l and parse.y files.
In addition to the ten standard project directories, there is an extra project aX; a special project GSL where C code is linked with the GNU Scientific Library; and a project PPM where C code is linked with a small Portable Pixel Map image library.
The special iPlot project provides a pre-built application for interactive plotting.
The HTML project supports programs generating HTML output.
The SS project provides an interface to a spreadsheet application.
The environment is accessible online at http://vecr.ece.villanova.edu/ and requires Villanova LDAP authentication. Static sample pages are shown here for course fc (Freshman C course).
Sample project home page:
frodo - fc - projectsa1, a2, a3, a4, a5, a6, a7, a8, a9, a10, aX, GSL, PPM, iPlot, HTML, SS,zip - download all projects Logout - (UserID logout with empty password) |
For system administrators and course instructors, the project home page also contains an option to set their UserID to any user. This is useful for grading and for helping students debug their programs.
Sample administrator project home page:
rperry - fc - projectsa1, a2, a3, a4, a5, a6, a7, a8, a9, a10, aX, GSL, PPM, iPlot, HTML, SS,zip - download all projects Logout - (UserID logout with empty password) |
Each project subdirectory page contains links to edit the programs, plus links to view (read-only) all files in the subdirectory. Each subdirectory is initialized with a Makefile and other files related to an assignment, such as input data files.
Sample a1 subdirectory page:
frodo - fc - a1HomeEdit: p1.c, p2.c, p3.c, p4.c, p1.h, p2.h, p3.h, p4.h, p1.sh, p2.sh, p3.sh, p4.sh, p1.txt, p2.txt, p3.txt, p4.txt, Makefile, p1.java, p2.java, p3.java, p4.java, scan.l, parse.y, p1.m, p2.m, p3.m, p4.m, p1.py, p2.py, p3.py, p4.py, View:
     360 Jan 23 14:10 Makefile
      84 Feb 12 11:39 p1.c
|
For a C++ course the Edit list would show .cc and .hh files instead of .c and .h.
In edit mode, a scrollable textarea contains the source code. Sample a1/p1.c edit page:
frodo - fc - a1/p1.ca1 - Home - preproc - asm - asmopt - disasm - cerr - clean - reload - rmcmts - indent - +frames - -frames |
After modifying project source code, Update copies the code to the server. After compiling using the Compile link, the program can be run using Run, or run via gdb for debugging using Debug.
If the program generates output values suitable for plotting, the Plot icon options can be used to pipe the output through a 2D or 3D plotting script to generate a GIF image.
If the program generates PPM image output,
the image can be viewed (converted to PNG) using the
image view icon

If the program generates output values representing audio samples at 8000 Hz., the Audio icon next to the Debug button can be used to convert to 16-bit WAV and play the audio directly in your browser.
C/Run performs compile and run in one step, IO runs the program with Interactive I/O, and IO/D runs gdb interactively. Program command-line arguments may be specified in the args input fields.
Additional options are:
Sample Compile output:
make p1 --- gcc -std=c11 -pedantic -Wall -g -lm -o p1 p1.c --- Done. |
Sample Run output:
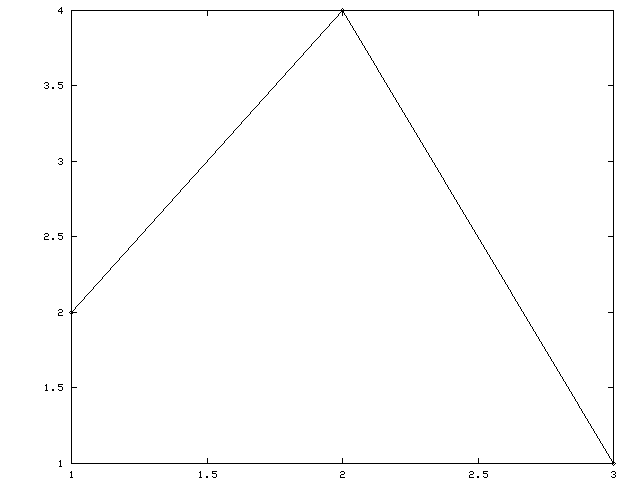
./p1 --- 1 2 2 4 3 1 --- Exit status = 12 |
Sample 2D Plot output:
|
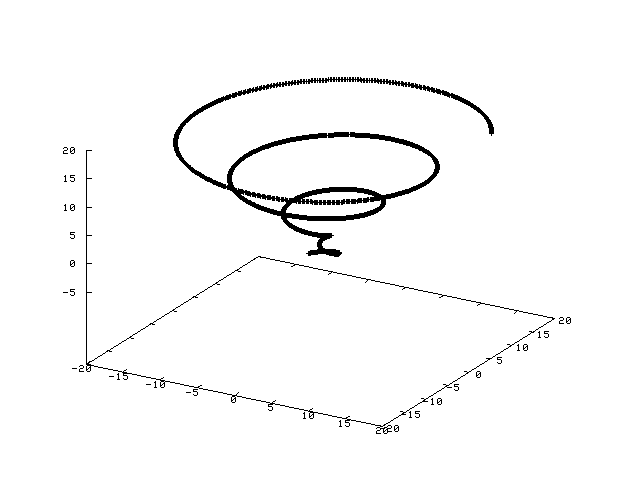
Sample 3D Plot output:
|
The environment is self-contained in a /vecr/ subdirectory of /home/httpd/. The web server runs chroot() in /home/httpd/ under uid/gid httpd. In order to run programs in this environment, /usr/, /opt/, and /proc/ are loopback mounted read-only there:
Filesystem            kbytes    used   avail capacity  Mounted on
/usr                 3008783 1380722 1567886    47%    /home/httpd/usr
/opt                10326052 1395670 8827122    14%    /home/httpd/opt
/proc                      0       0       0     0%    /home/httpd/proc
The web server maps URLs starting with /prog/ to CGI scripts in the /vecr/cgi/ directory:
<Directory /vecr/cgi>
Options None
</Directory>
ScriptAlias /prog/ "/vecr/cgi/"
/vecr/cgi/ contains links to a setuid-root compiled C program:
# pwd
/home/httpd/vecr/cgi
# ls -li ccs fc
     66721 ---s--x---   2 root     httpd       5980 Feb  2 09:13 ccs
     66721 ---s--x---   2 root     httpd       5980 Feb  2 09:13 fc
#
which is a wrapper that
sets the real and effective uid and gid to 0
and invokes the view.pl perl script.
The wrapper also sets an environment variable COURSE from the link name,
currently either ccs for the Computer Communications Security
course, or fc for the Freshman C course. The COURSE
environment variable is used to determine the course-specific user
home directory location.
The action taken by view.pl depends on whether the HTTP request was GET or POST. For GET, it prepends "GET" to the arguments and exec's the view.sh shell script. For POST, it parses the form input name/value pairs, opens a pipe to stdin of view.sh, prints the mode (update, run, debug, plot, etc.) and arguments, then prints the data from the textarea field (i.e. the C, Java, or dash source code being edited).
view.sh dynamically creates the web pages from which it is reinvoked using GET or POST via the wrapper and perl script. It logs the connection, sanitizes the REMOTE_USER string and extracts the UserID (e.g. extracts rperry from the LDAP DN "uid=rperry,ou=Faculty,ou=Employees,o=villanova.edu"), creates a new unique uid/gid for the UserID, if necessary, and creates project subdirs. Then it handles the GET or POST request, creating additional user files, such as symlinks to files in the prototype project directories, as needed. lib/ contains the database mapping UserID's to uid's, and a counter file used when creating a new uid.
For GET edit and POST update requests, view.sh handles some of the request itself, running as root, then runs a separate update.sh script under the uid/gid of the user. For all other requests, it runs a separate run.sh script under the uid/gid of the user. Also, for the POST run, debug, plot, and command requests, it uses the dash version of ulimit to limit resources.
run.sh runs under the user uid/gid. It determines whether C, Java, or dash is being used based on the file name extension. For compile, run, debug, and plot, it runs the command, including any user-supplied command-line arguments, using a run program which limits the run time to 30 seconds. The limits placed on run-time and other resources help prevent accidental runaway processes.
(disabled pending redesign)
Interactive programs can be run using the IO option.
Example: frodo - fc - a4/p1.c
#include <stdio.h>
int main( void)
{
  double d;
  while( 1)
  {
    printf( "Enter a number: ");
    if( scanf("%lf",&d) != 1) break;
    printf( "d = %g, 1/d = %g\n", d, 1/d);
  }
  return 0;
}
Using the IO option:
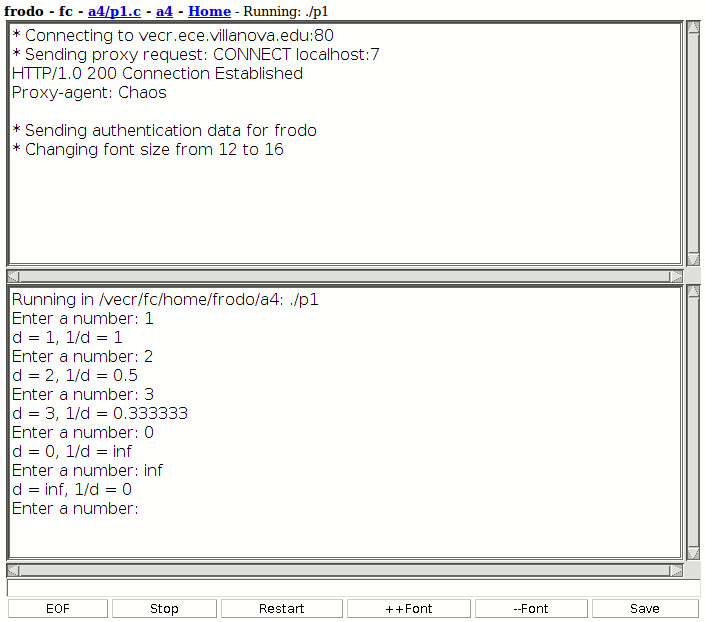
The IO applet connects through the web server as a proxy to a Java server to run the program. The top area of the window displays diagnostic information about the connection. The middle area displays the program input and output. Input is typed at the bottom and is copied to the middle area whenever the user presses Enter to send the input to the program.
Options at the very bottom are available to signal end-of-file, stop/disconnect, restart the applet, change font size, and save the output window to file "output.txt" on the server.
The applet starts by requesting a proxy connection through the web server to localhost port 7 where a Java server is listening:
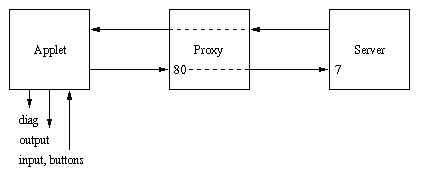
The Java server then creates a client thread to communicate with the applet:
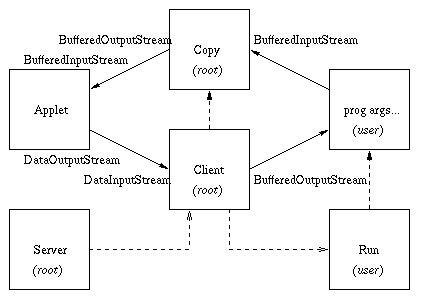
In the figure above, the transparent web server proxy between the Applet and Copy/Client threads is not shown. After creating the client thread, the Java server is no longer involved in the communications but is shown to complete the diagram of parent/child process relationships drawn with dashed lines. That is, the Server, running as root, creates the Client thread, also running as root. After verifying authentication data from the applet, the Client thread creates a Copy thread, running as root, to handle copying program output back to the applet. The Client thread also creates a Run process, running as the user, which runs and monitors the user program. When needed for the Save option, the Client thread creates a temporary Save process which is not shown in the figure.
Applet authentication data consists of the user name and uid, time, and a ticket. This data, as well as the user directory, program to run, and command-line arguments, are obtained by the applet from parameters passed in the IO web page, for example:
<applet codebase="/vecr/IO" code="IOapplet.class" width=700 height=600>
<param name="user" value="frodo">
<param name="uid" value="3001">
<param name="time" value="1108241035769">
<param name="ticket" value="6afb9f2c5068c68818b202b8995ab03ea7dcc0f13ca70d77ba0215c935b781a5">
<param name="dir" value="/vecr/fc/home/frodo/a4">
<param name="prog" value="./p1">
<param name="args" value="">
The ticket is an HmacSHA256 message authentication code based on a secret, the current time, the user name and uid, created when the IO option is selected. Authentication consists of verifying the ticket and checking that it is not too old. Since the user was already known to be authenticated at the time the IO option was initiated, the ticket allows that authentication to propagate from the applet to the server without having the user resend their userid and password.
After authentication, the applet
communicates with the Client
using DataOutputStream writeByte() for bytes and writeUTF() for strings
to implement a simple protocol
using byte constants DATA, EOF, STOP,
and SAVE. When the user presses Enter in the input area,
the applet sends the DATA byte followed by the input
string. Similarly, for the Save option,
the applet sends the SAVE byte followed by the output
text area in a string. For EOF and STOP options, the
applet sends the corresponding EOF or STOP byte.
On the server side, the main Client loop uses a switch statement
to select the action corresponding to the protocol byte.
A separate document is available on security issues related to IO Authentication.
The parts which run as root should not contain flaws which may allow creation or overwriting of arbitrary files or execution of arbitrary user input. Some additional safeguard for the system is provided by running in a chroot environment with read-only, nosuid loopback mounts.
The parts which run as the user allow access to most features of a standard Unix login account, but in a chroot environment with some resource limitations. Since the user can run an arbitrary C, Java, or sh program, there would be little security gained by restricting what can be placed in the command-line arguments to be executed by the shell. In fact, run.sh uses dash eval to run the user programs on purpose to enable use of pipelining and I/O redirection, and the Command option runs an arbitrary Unix command entered into the args input field.
User file security is provided by having the home directories owned by root and readable only by the specific user group, e.g. for user rperry with uid=gid=3002:
# pwd
/home/httpd/vecr/fc/home/rperry
# ls -ld . a1
drwxr-x---  12 root     3002         512 Feb  2 10:01 .
drwx------   2 3002     3002         512 Jan 23 19:23 a1
#
So users can not change the permissions on their home directory and can not see other users files.
Output suitable for 2D plotting is one x,y pair per line. A program can also just print one y value per line and the plot will have an automatic x axis.
Plots are generated using gnuplot, and gnuplot help plot datafile says:
...
 Only one column (the y value) need be provided.  If x is omitted, `gnuplot`
 provides integer values starting at 0.

 In datafiles, blank records (records with no characters other than blanks and
 a newline and/or carriage return) are significant---pairs of blank records
 separate `index`es (see `plot datafile index`).  Data separated by double
 blank records are treated as if they were in separate data files.

 Single blank records designate discontinuities in a `plot`; no line will join
 points separated by a blank records (if they are plotted with a line style).
...
You can look at the 2D plot script, which basically does this:
(echo "set term gif\nset output\nplot '-' notitle with linespoints"; cat) |
 /usr/bin/gnuplot
to plot standard input, which comes from standard output of the program. Standard error is redirected to a file plot.stderr in the current project directory.
The 3D splot script is similar, and uses the gnuplot splot command, for which help splot datafile says:
...
 Data file organization is essentially the same as for `plot`, except that
 each point is an (x,y,z) triple.  If only a single value is provided, it
 will be used for z, the datablock number will be used for y, and the index
 of the data point in the datablock will be used for x.  If two or four values
 are provided, `gnuplot` uses the last value for calculating the color in
 pm3d plots.  Three values are interpreted as an (x,y,z) triple.  Additional
 values are generally used as errors, which can be used by `fit`.

 Single blank records separate datablocks in a `splot` datafile; `splot`
 treats datablocks as the equivalent of function y-isolines.  No line will
 join points separated by a blank record.  If all datablocks contain the same
 number of points, `gnuplot` will draw cross-isolines between datablocks,
 connecting corresponding points.  This is termed "grid data", and is required
 for drawing a surface, for contouring (`set contour`) and hidden-line removal
 (`set hidden3d`). See also `splot grid_data`.
...
Standard error is redirected to a file splot.stderr in the current project directory.
The iPlot project provides a pre-built application for interactive plotting of three types of functions.
Sample iPlot subdirectory page:
frodo - fc - iPlotHomeEdit: View: |
The function types are:
double func( double x)Multiple functions can be defined to display on one plot. The function names are specified in an array at the end of p1.c, for example:
double (*f[])(double) = { f1, f2, 0};
  typedef struct { double x, y; } Point;

  Point func( double t)
Multiple functions can be defined to display on one plot.
The function names are specified in an array at the end of p1.c,
for example:
Point (*f[])(double) = { f1, f2, 0};
  double f( double x)
  double fp( double x)
where fp is the derivative of f. In this case the plot provides an option to use Newton's method to find a zero of the function f.
For all three types, function return values equal to HUGE_VAL
are not plotted. This can be used to skip unwanted or undefined values.
Sample iPlot/p3.c run, including Newton:
iPlot has options to interactively regenerate the plot shifting left or right, or zooming in or out. X, Y, and Title labels for the plot can be specified, the axes can be enabled or disabled, and the plot style can be adjusted to use lines, points, or both. When using Newton's method, the button normally named "Save" (which saves the display in an html file) is renamed "NSave" to select rerunning Newton and saving.
The iPlot project directory configuration is different from the other projects. The user only has to create functions in C, not a complete program. The Makefile generates executables by linking with one of the object files compiled from iPlot.c, which includes a main program to generate the data for plotting. p1, p2, and p3, which would be compiled C executables in the other project directories, are all just symbolic links to an iPlot.sh shell script which runs the real executable to generate the plot and provides the interactive features.
The idea for iPlot started with a course assignment to create a rudimentary interactive plotting script, in VECR. To enable HTML output instead of the default plain text, VECR was modified to send a "Content-type: text/html" header when a particular project script (e.g. a9/p1.sh) was run. VECR itself originated to support a course assignment in Fall 2002 allowing one to "view", "edit", and "run", a single shell script generating HTML for an interactive directory/file browser.
As noted above regarding the background of iPlot, VECR has sometimes been modified to send a "Content-type: text/html" header when a particular project script was run. The HTML project directory is a generalization of that concept - the html header is sent whenever any program is run in the HTML project.
A program in the HTML project should generate valid HTML output. Forms can be used, posting back to the program itself or to another program. There are two form input names which can be used: args which is passed as command-line arguments; and data which is passed on standard input. Multiple instances of these inputs are concatenated together, and can be separated using hidden inputs.
The environment variable COURSE can be used to refer to the parent directory of the HTML project, as can be seen in this example HTML/p1.sh script:
read data1
rest=`cat`
echo "<html><head><title>test</title></head>
<body bgcolor=white text=black>
<form method=POST action=\"/prog/${COURSE}?HTML+p1.sh\">
arg1: <input name=args size=10 value=\"$1\">
<input type=hidden name=args value=\" \">
<br>arg2: <input name=args size=10 value=\"$2\">
<br><input type=submit name=data value=\"Button1\">
<input type=submit name=data value=\"Button2\">
<input type=hidden name=data value=\" \">
<br><textarea name=data rows=2 cols=20>
$rest
</textarea>
<br>data1 = $data1
</form></body></html>"
After running this script and filling in some data for the input fields,
selecting Button1 produced the following
example output:
iPlot.sh is another example using forms and HTML output.
The SS project provides an interface to a spreadsheet application, including 2D and 3D plotting of spreadsheet output.
Sample SS subdirectory page:
frodo - fc - SSHomeEdit: View: |
The provided spreadsheet application is documented separately and may be overridden by the users own spreadsheet program simply by replacing the SS and ss symbolic links.
The requirements for the spreadsheet application to work properly in the VECR/SS project are:
  eval [args]           evaluate with optional arguments
  print values          display the cell values
  print formulas        display the cell formulas
  print pointers        display the cell formula pointers
  print formats         display the cell formats
  print symbols         display any symbols which have been defined
  plot2d range          display the specified range values directly
  plot3d range          display the specified range, one line per cell,
			 in the form: row col value
Sample SS run with 3D plot:
vecr.tar.gz contains the complete documentation and source code.